About Me

I'm an experienced Data Analyst with a M.S. in Statistics. In my latest role, I helped a medical supplies retailer improve their marketing efforts by automating the measurement, analysis, and reporting of their marketing activities. Before that, I consulted and reporting of their marketing activities. Before that, I consulted for various clients, bubbling up insights to key decision-makers.Broadly, my experience covers the education, medical, and e-commerce industries. Also, I got M.S and B.S in mathematics from Kent State University, and instructed college math courses for 3 years.
Software and Programming
• Jupyter Notebook, Spyder
• Python Analysis (Numpy, Pandas, Statsmodels)
• Python Visualization (Matplotlib, Seaborn, Plotly)
• Python Machine Learning (SciKit-Learn,TensorFlow)
• Python Web Scraping (Scrapy, BeautifulSoup)
• R (ggplot2, dplyr, tidymodels)
• SAS
• Selenium
• Tableau
• MS PowerBI
• Git
• Flask
Database
• SQL
Web
• HTML5 (notepad++)
Project
Glassdoor Data Science Salary Project
• Used Selenium to web-scrape the information of data science job postings from glassdoor.
• Built a word cloud to visualize the most common word used in the job description.
• Constructed linear regression, lasso regression, and random forest models on training set data, and predict the test set data with models, selected the model that performs the best.
• Used Flask to turn the model into an API endpoint that takes in job posting data and returns an expected salary.
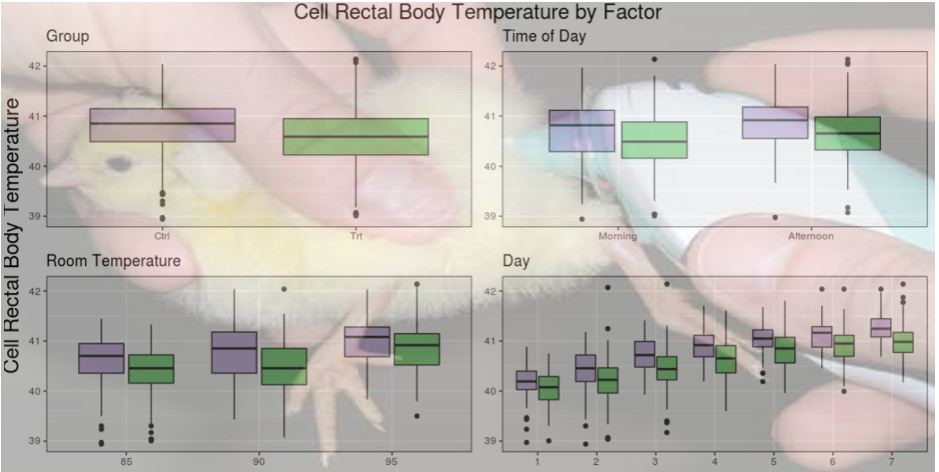
Effect of Air Movement on Chicks’ Body Temperature Project
• Cleaned the dataset including eliminating the unrelated variables and combining the repeated measurements.
• Built and Tested the model for chicks’ rectal temperature vs. frank temperature and improved the experiment error by showing the chicks’ rectal temperature measurements can be replaced by frank’s temperature measurements.
• Constructed and Tested a mixed model with a random effect on chicks’ body temperature under different brooding conditions.
• Built an R visualization solution for chicken’s best-brooding conditions to improve poultry production.
Automobile Pricing Project
• Built a mixed model on car prices, selected the best model via subset model selection and estimated the missing car price value based on the model.
• Performed the model training on the training dataset and assessed the model with test sets via K-folds cross-validation..
• Built an R visualization to analyzing the key factors that describe a car’s price in the US market.
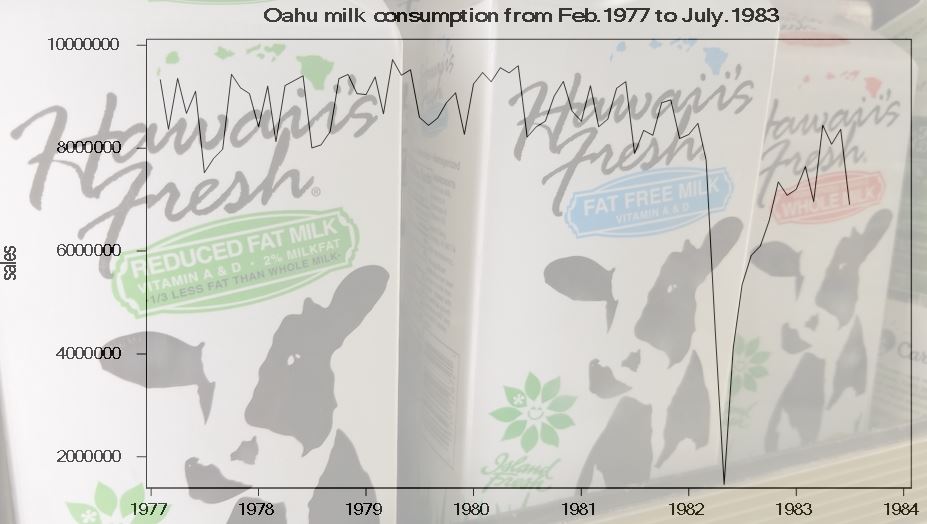
Hawaii Milk Consumption Project (Time-Series-Analysis)
• Constructed interventional models for time series data and selected the best model via subset model selection.
• Built a SAS data visualization based on the model to forecast the milk consumption for next year.
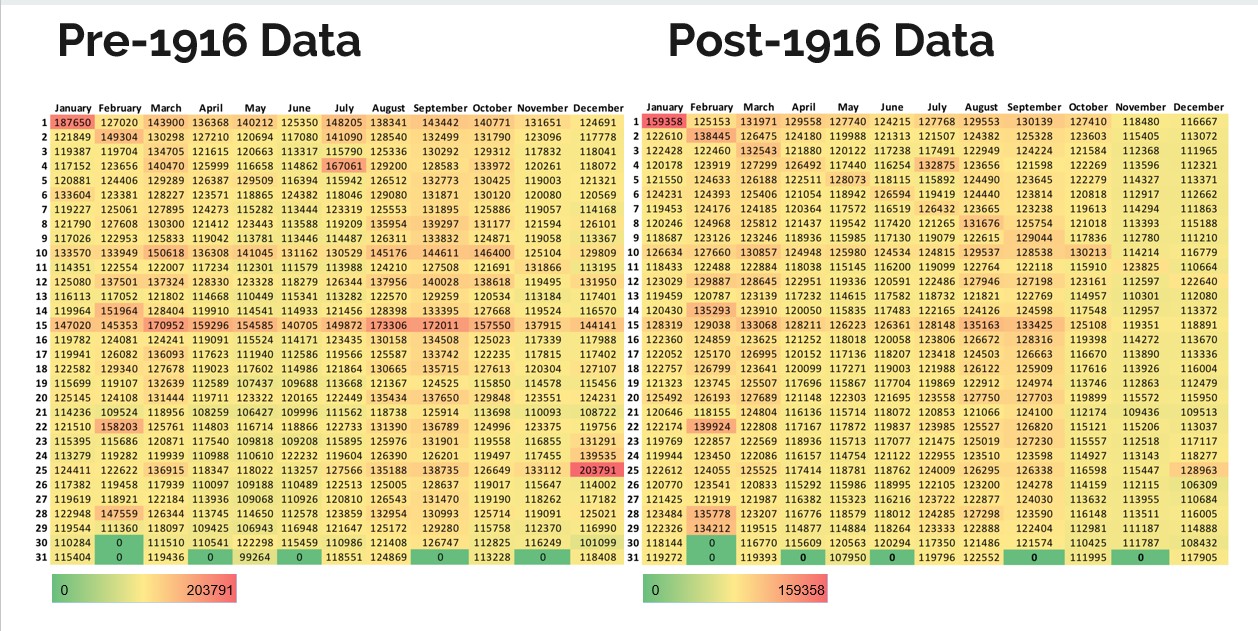
Death Master File Project
• Built spline regression models for ‘before 1960’ and ‘after 1960’ datasets, and justified the mis-entered data.
• Constructed an R visualization and analyzed the seasonality of the US birthrate.
• Built PowerBI heat maps to compare the popular birthdate before 1960 and after 1960.
Survival analysis of breast cancer treatments Project
• Computed and plotted the Kaplan-Meier estimate of survival for the drug treatment group and the placebo treatment group.
• Tested the equality of two treatment groups via log-rank test and the Wilcoxon test and analyzed the survival rate of two groups.
Optimal Chemotherapy Project
• Constructed polynomial models for ATP levels of cancer cells and normal cells concerning three drugs.
• Performed the multivariate regression analysis to analyze the mixed effect of three drug drugs on both cells under different drug does level.
• Built a SAS data visualization solution for the best drug does level of three drugs of in treating the cancer cells while reducing the toxicity to normal cells.
Drugs effectiveness on rats Project
• Built regression models on the anxiety of rates concerning drugs and doses and selected the best model via subset model selection.
• Constructed a SAS data visualization to learn the responses of rats to two different drug doses.
Contact
Elements
Text
This is bold and this is strong. This is italic and this is emphasized.
This is superscript text and this is subscript text.
This is underlined and this is code: for (;;) { ... }. Finally, this is a link.
Heading Level 2
Heading Level 3
Heading Level 4
Heading Level 5
Heading Level 6
Blockquote
Fringilla nisl. Donec accumsan interdum nisi, quis tincidunt felis sagittis eget tempus euismod. Vestibulum ante ipsum primis in faucibus vestibulum. Blandit adipiscing eu felis iaculis volutpat ac adipiscing accumsan faucibus. Vestibulum ante ipsum primis in faucibus lorem ipsum dolor sit amet nullam adipiscing eu felis.
Preformatted
i = 0;

while (!deck.isInOrder()) {
    print 'Iteration ' + i;
    deck.shuffle();
    i++;
}

print 'It took ' + i + ' iterations to sort the deck.';
Lists
Unordered
- Dolor pulvinar etiam.
- Sagittis adipiscing.
- Felis enim feugiat.
Alternate
- Dolor pulvinar etiam.
- Sagittis adipiscing.
- Felis enim feugiat.
Ordered
- Dolor pulvinar etiam.
- Etiam vel felis viverra.
- Felis enim feugiat.
- Dolor pulvinar etiam.
- Etiam vel felis lorem.
- Felis enim et feugiat.
Icons
Actions
Table
Default
| Name |
Description |
Price |
| Item One |
Ante turpis integer aliquet porttitor. |
29.99 |
| Item Two |
Vis ac commodo adipiscing arcu aliquet. |
19.99 |
| Item Three |
Morbi faucibus arcu accumsan lorem. |
29.99 |
| Item Four |
Vitae integer tempus condimentum. |
19.99 |
| Item Five |
Ante turpis integer aliquet porttitor. |
29.99 |
|
100.00 |
Alternate
| Name |
Description |
Price |
| Item One |
Ante turpis integer aliquet porttitor. |
29.99 |
| Item Two |
Vis ac commodo adipiscing arcu aliquet. |
19.99 |
| Item Three |
Morbi faucibus arcu accumsan lorem. |
29.99 |
| Item Four |
Vitae integer tempus condimentum. |
19.99 |
| Item Five |
Ante turpis integer aliquet porttitor. |
29.99 |
|
100.00 |


